Basic Business Intelligence (BI)
The term Business Intelligence (abbreviation BI) has been around since the early 1990s. BI is an important business application. Business intelligence refers to procedures and processes for the systematic analysis of data in electronic form (collection, evaluation, presentation). Market interest in business intelligence solutions is growing steadily.
Unsuitable reporting and analysis functionality in existing ERP solutions are a strong driving force. The need to consolidate data from upstream systems is present almost everywhere. Many of the front ends available on the market are only suitable for specialist users with IT knowledge. However, end users need easy-to-use front ends for those without IT expertise.
The term Business Intelligence (abbreviation BI) has been around since the early 1990s. BI
Process consists of the 3 process stages, data procurement, analytical evaluation and presentation function. 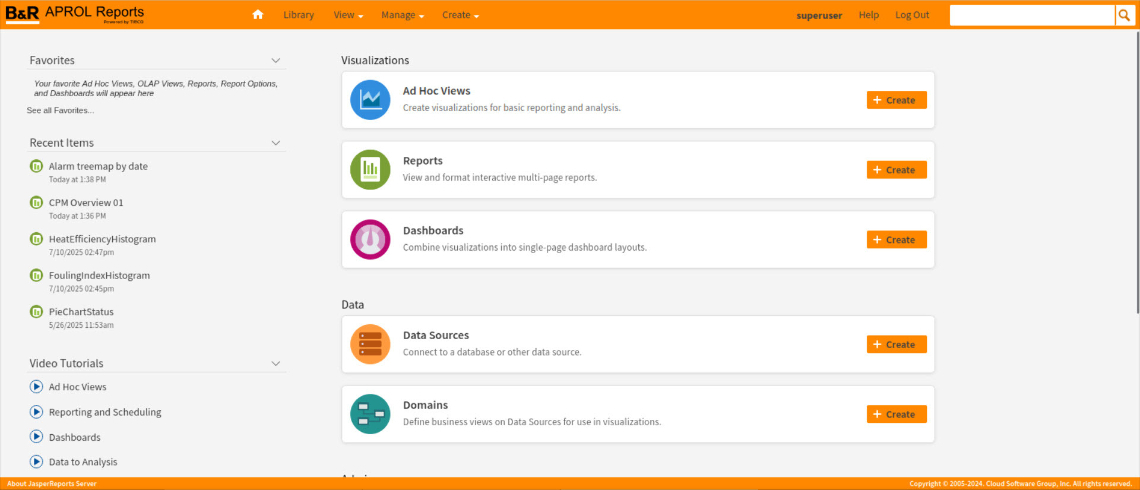
Presentation function – Standard reporting
Standard reporting
Form and content are largely fixed in standard reporting, but diagram types can be easily changed.
Interactive reports
Within a very short time, interactive reports can be created pixel-perfect with diagrams and tables for printing or online display. A browser-based, interactive display tool allows users to change the filter and sort functions as well as column formats and save them in the report repository.
Numerous export formats are available.
Publication (export) is freely selectable in PDF, XLS, XLSX, XML, HTML, XHTML, CSV, DOC or ODT format for convenient further processing.
Presentation function – "Ad-hoc reporting"
The user defines the layout of the report independently when it is being generated.
Analysis software
Self-service analysis solutions make it easy to query data and use it interactively. They provide the user with valuable information for decision-making.
Interactive reports
Within a very short time, interactive reports can be created pixel-perfect with diagrams and tables for printing or online display. A browser-based, interactive display tool allows users to change the filter and sort functions as well as column formats and save them in the report repository.
Numerous export formats are available.
Publication (export) is freely selectable in PDF, XLS, XLSX, XML, HTML, XHTML, CSV, DOC or ODT format for convenient further processing.
Presentation function – Dashboard
The dashboard is similar to a pilot's cockpit. The data is clearly displayed using speedometers, line diagrams, traffic lights, maps, etc.
Dashboard software
Dashboard software makes it possible for users to combine data and graphic indicators and consolidate important information. Multi-report dashboards can be created using both internal and external data.
Web-based dashboard design tool
Dashboards are created from multiple components using an intuitive, web-based drag-and-drop design tool. Selected parameters enable even more interactive work and give users the flexibility they need to display and analyze data in the shortest possible time.
Presentation function – Mobile data analysis
An iPhone or Android app enables convenient access to dashboards and reports.
Mobile access
Reports and dashboards can be displayed and used interactively with the native iPhone or Android app. The touch-enabled browser can be used to create reports and analyze data on tablet devices.
Security via server-side authentication
The necessary security for mobile and tablet devices is guaranteed by server-side authentication.
System structure – APROL reports powered by Jaspersoft
The integrated Jaspersoft BI Enterprise Edition includes a BI server and offers self-service reports as well as dashboards. Web-based tools allow users to create customized reports and display interactive dashboards without any previous technical expertise.
Report design tool
The user-friendly report design tool with drag-and-drop function enables the creation, formatting and distribution of reports for standard browsers or mobile devices. Reports can be generated using various data sources such as MySQL, JDBC, XML and CSV. A metadata layer with data virtualization functions guarantees access to multiple data sources, ensures data security and simplifies the underlying structure for users without prior technical knowledge.